
Projects
What's measured improves. What's measured and reported improves exponentially. (I heard this from Joe Polish)
When I was in 4th grade, I completed a science fair project that compared batteries. I measured how long batteries lasted and included the cost per minute. At the time of the contest, I favored one of the batteries personally because of humorous marketing. That favorite battery of mine didn't last the longest, nor was the best cost per minute.
From this project, I learned to put aside my personal view of things and measure as precisely as possible. I did not win first place in the science fair. I mailed each battery company a hand-written letter showing a summary of my findings (including hand-drawn graphs and tables!). One of the battery companies replied with a letter, a toy, and some free batteries. I fully admit that in 4th grade, a toy beat a blue ribbon.
This early project started my journey in data. I learned that if I had a question, I could create a test, measure data, and come to my own conclusions. Since 4th grade, I continue doing my own research as well as completing data and research project for clients.
Below are some of my favorite projects that I've completed. All of these projects involve my own intellectual property.
App Diagnostics
Problem: Engineering teams averaged over 170 hours per week on identifying, tracking and resolving ("troubleshooting") application errors. Created a diagnostic tool to identify and track diagnosis with "solutioning" in mind.
Result: In the first month of use, engineering teams saw a reduction of 49 hours of troubleshooting per week. In measuring engineering use, I improved the diagnostic application. The second and third months saw a decrease of 116 hours of troubleshooting per week. The final update resulted in 18 hours of troubleshooting per week by engineering teams.
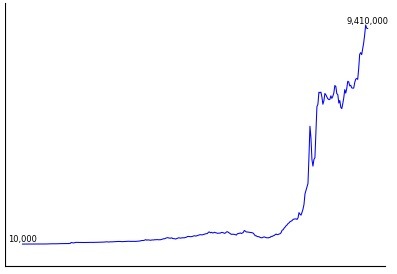
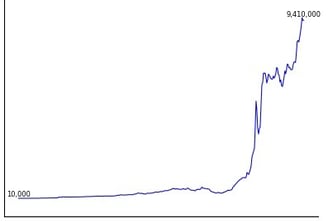
Business Treasury
Problem: In 2006, I uncovered inflation was being significantly underreported. For my business, I began investigating a business treasury instrument.
Result: In the period of time measured from available data, the CAGR of the business treasury instrument exceeded 28% over its history including a cost adjustment associated with maintaining the instrument.
Comparison* (over a similar period of time):
Gold CAGR: 9% (rounded)
S&P 500 CAGR: 8% (rounded)
Nasdaq CAGR: 10% (rounded)
US 10 Year Treasury CAGR: 4% (rounded)
* Gold's CAGR since 1971 disconnect is 8% (rounded); S&P 500's CAGR since 1957 inception is 11% (rounded); Nasdaq 100's CAGR since 1985 inception is 15% (rounded). All figures rounded and nominally used here.
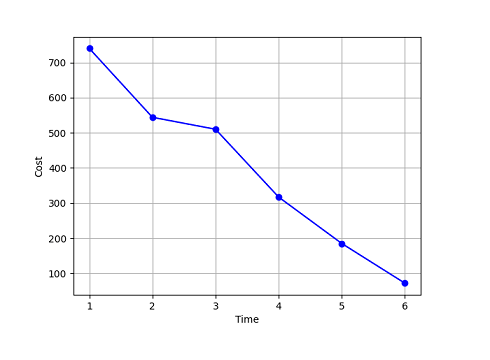
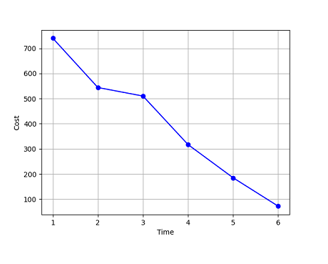
Healthcare
Problem 1: Vague terminology of healthcare costs.
Problem 2: Specific disease incurred a significant comprehensive healthcare cost for both patients and medical practitioners.
Results: Defined healthcare costs with a holistic measure - hereafter referred to as units. Uncovered that both patients and medical practitioners paid 7,896 units cost per diagnosis of disease. Reduced the cure cost to 3,079 units. Researched preventative measures to reduce costs to 780 units.
Note: Due to overwhelming bureaucracy, no healthcare data services are available for countries in the European Union or United States of America.


Data Consolidation
Problem: 17TB of data creating costs for storage and disaster recovery. Further costs with complex development to handle the scale of the data size along with administering the data environment.
Results: Reduced data environment size 97% along with reducing storage and performance costs by over 80%. Updated tools that would minimize (or eliminate) software licensing fees while providing deeper insights into costs for leadership.